Japan Tourism Shift: US Leads Spending as Chinese Visitors Drop 48.8%
In Q2 2026, US tourists became top spenders in Japan as Chinese visitor spending fell 48.8%. Discover the data, analysis, and what it means for global travel trends.
Source: 候鸟房东
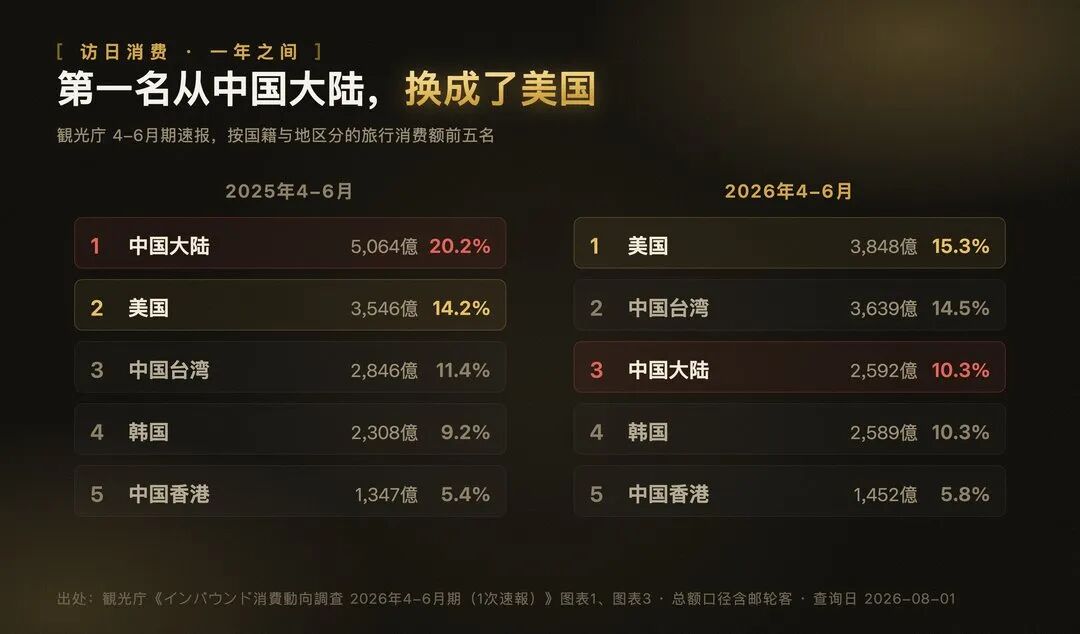
When Japan's tourism board released its April–June spending report on July 15, the headline wasn't about a new record—it was about a changing of the guard. For the first time in years, mainland China wasn't the top spender among foreign visitors. Instead, the United States took the crown, but not because Americans suddenly splurged. The real story lies in a dramatic 48.8% drop in Chinese spending, a shift that reshapes Japan's inbound tourism landscape and offers a fascinating case study in how rankings can mislead.
Key Takeaways
-
US tourists now lead Japan spending: In Q2 2026, US visitors spent ¥384.8 billion (15.3% of total), overtaking mainland China, which fell to third place with ¥259.2 billion (10.3%). Taiwan took second with ¥363.9 billion (14.5%). The shift wasn't due to a US spending surge—only +8.5% year-on-year—but rather China's steep decline.
-
Chinese spending halved, but per-person spending rose: Chinese visitors spent ¥259.2 billion in Q2 2026, down from ¥506.4 billion a year earlier (-48.8%). However, their per-capita spending actually increased by 9.4% to ¥266,753. The drop was almost entirely in visitor numbers, which fell 52.5% to 971,000. Those who did travel spent more, particularly on shopping.
-
The spending gap reveals different priorities: Despite similar visitor numbers (US: 1.016 million, China: 971,000), US tourists spent ¥1.258 trillion more. The biggest difference is accommodation: US visitors spent ¥158,095 per person on lodging, while Chinese visitors spent only ¥78,793—a gap that accounts for 70% of the total difference. Conversely, Chinese tourists outspent Americans on shopping by ¥31,091 per person, making them the biggest shoppers among major source markets.
-
Taiwan is a rising contender: Taiwan's spending surged 27.9% year-on-year to ¥363.9 billion, nearly matching the US. With only a ¥20.9 billion gap, the top spot is now a three-way race among the US, Taiwan, and China, a stark contrast to last year when China held a 20% share and others trailed far behind.
-
The 'first place' is not a victory but a vacancy: The US didn't outcompete China; it simply filled a void. While Chinese spending plummeted, the gap was distributed across multiple markets—no single country absorbed the lost 20.2% share. This fragmentation means Japan's tourism is now more diversified but also more volatile.
-
Data nuances matter: The report includes two different year-on-year figures for China: -48.8% (total spending, including cruise passengers) and -48.1% (general visitors only). Average stay durations also vary by purpose: Chinese tourists stay 11.2 nights overall but only 6.9 nights for sightseeing, versus 10.4 nights for US sightseers. These distinctions are crucial for accurate interpretation.

Deep Dive Analysis
This shift in Japan's inbound tourism spending is more than a simple ranking change; it reflects deeper structural shifts in global travel. China's 48.8% drop in spending is not an isolated event but part of a broader trend of Chinese outbound tourism cooling, influenced by economic slowdown, currency depreciation, and changing consumer preferences. Meanwhile, the US market's modest growth (+8.5%) suggests a mature, steady traveler base rather than a sudden boom. The real story is the fragmentation of Japan's source markets. Last year, China dominated with a 20% share, but now the top three are within 5 percentage points of each other. This diversification is healthier in the long run, reducing reliance on any single market, but it also means Japan must cater to a wider range of preferences—from budget-conscious Chinese shoppers to high-spending US tourists who prioritize accommodation.
Looking ahead, Japan's tourism industry faces both opportunities and challenges. The rise of Taiwanese and other Asian markets (e.g., Korea +12.2%) could offset some of China's decline. However, the yawning gap in accommodation spending suggests that Chinese tourists are still price-sensitive, and Japan may need to adjust its hospitality offerings to attract them back. The data also highlights a potential data literacy issue: rankings can be misleading. As the article notes, a new #1 doesn't always mean a stronger player; sometimes it means the old leader stepped back. For industry observers, this is a reminder to look beyond headlines and analyze underlying numbers.

Frequently Asked Questions
Why did Chinese tourist spending in Japan drop so sharply? The primary driver was a 52.5% decrease in visitor numbers, likely due to economic factors in China, travel restrictions, or shifting preferences. Per-capita spending actually rose 9.4%, indicating that those who did travel were willing to spend more, especially on shopping.
Is the US now the most valuable market for Japan tourism? In terms of total spending, yes, but the margin is thin. US tourists spend more per trip, especially on accommodation, but their growth is modest. Taiwan is close behind and growing faster. Japan should not rely solely on the US; a diversified portfolio is more resilient.
How should I interpret the different spending figures for Chinese tourists? The report provides two year-on-year changes: -48.8% for total spending (including cruise passengers) and -48.1% for general visitors only. The difference is due to the inclusion of cruise passengers, who spend less. Always check which metric is being used in discussions.

Source: https://mp.weixin.qq.com/s/IifybjQbwniC8b87JULDBQ
Related posts

Volkswagen to Cut 100,000 Jobs: Inside the Biggest Automaker Restructuring
Volkswagen plans 100,000 job cuts, four German plant closures, and a halved model lineup by 2035 as profits collapse and China earnings shrink.

Alibaba Scrapped Its P-Level System: What It Means for Your Company
Alibaba dismantled its 19-year-old P-level hierarchy in 2023. Here's why high-level 'performers' drain profits, and how smaller firms can cut layers before it's too late.

China's 2026 Unicorn Rankings: AI Reshapes the Top 10
China ranks second globally with 381 unicorns. AI leads the 2026 list as ByteDance, Ant Group, and DeepSeek dominate. Explore the shifting landscape.

ByteDance Boosts AI Talent Incentives with Doubao Stock Hike
ByteDance raises Doubao stock price by 14.6% to retain AI talent, expands equity incentives, and integrates teams to accelerate AI adoption in the workplace.
Chinese Mobile Games Dominate Japan & Korea Q2 2026 Revenue Charts
Diandian Interactive's Whiteout Survival and Kingshot top Japan/Korea Q2 2026 revenue rankings. Market shows steady growth with iOS users spending 1.2x more. Full analysis inside.

Global Mobile Gaming Revenue Dips 1% in August: Why Mid-Tier Games Are Losing
Sensor Tower's August report reveals a $66M monthly revenue drop in mobile gaming. Top titles grow while mid-tier suffers. Insights on market shifts, regional trends, and what it means for developers.

China Southern Airlines Incheon Airport Ground Staff Recruitment 2026: A Gateway for Bilingual Talent
China Southern Airlines is hiring ground staff at Incheon International Airport for 2026. Learn about the role, requirements, and why this is a strategic opportunity for Korean-Chinese bilinguals.

Korea Coast Guard 2026 Chinese Translation Exam: Key Dates & Rules
Korea Coast Guard's 2026 3rd recruitment Chinese translation written exam set for Sept 5. Learn schedule, scoring, ID rules, prohibited items, and results date.
Latest Articles
- US Budget Deficit Reaches $2 Trillion in FY 2026: A Warning Sign for Global Markets
- South Korea Successfully Tests First Indigenous Hypersonic Glide Vehicle
- EU Parliament Report on China: Diplomatic Response & Future Outlook
- Starbucks Acquisition of Chipotle: A Strategic Fit or Financial Overreach?
- Japan Requests China Show 'Respect' to Prime Minister, Sparks Diplomatic Row
- Skydance & Warner Bros. Merger: Building the Next Gen Media Giant